> ## Documentation Index
> Fetch the complete documentation index at: https://docs.saasybill.com/llms.txt
> Use this file to discover all available pages before exploring further.
# Dashboard
> A snapshot of your key billing metrics, revenue trends, and recent activity
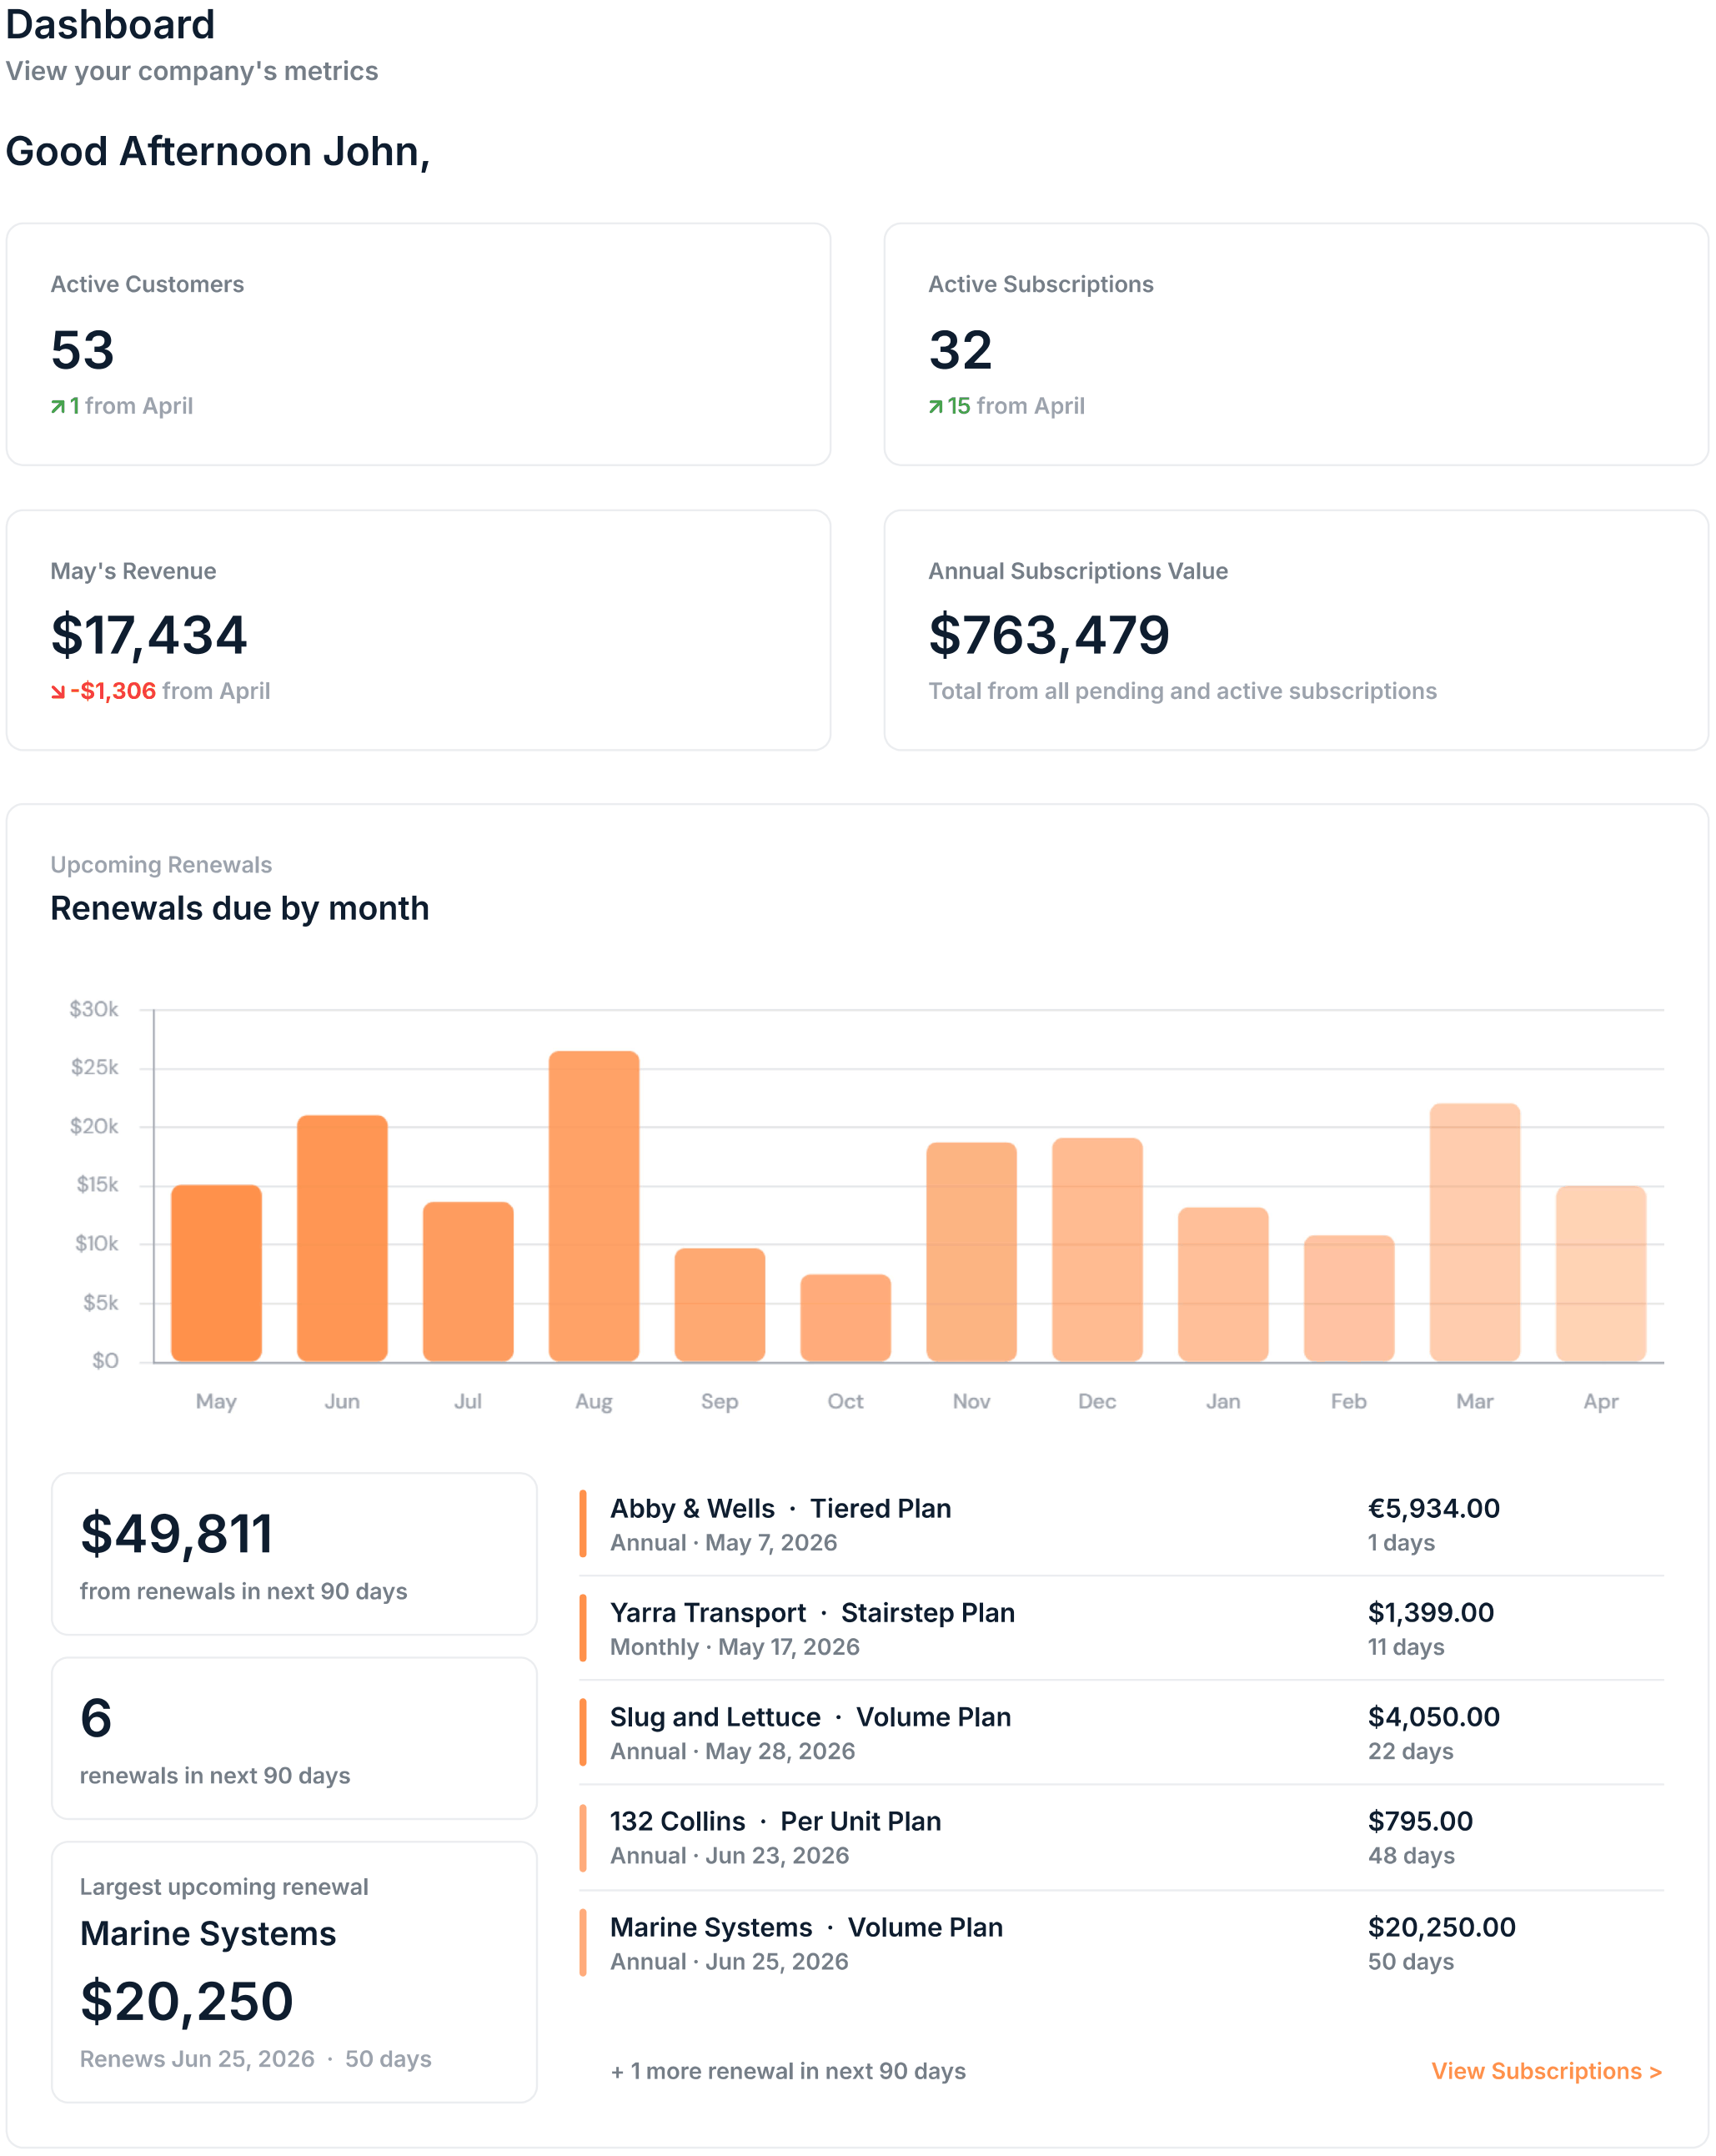
The Dashboard gives you a live overview of your billing health, active customers and subscriptions, revenue for the period, and a breakdown of how that revenue is distributed.
 ***
## Getting started
If your account is newly set up, a **Getting Started** tile appears on your dashboard. It guides you through the initial steps of syncing customers, creating your first plan, and adding your first subscription.
This tile disappears once you have completed all the Getting Started steps
***
## Key metrics
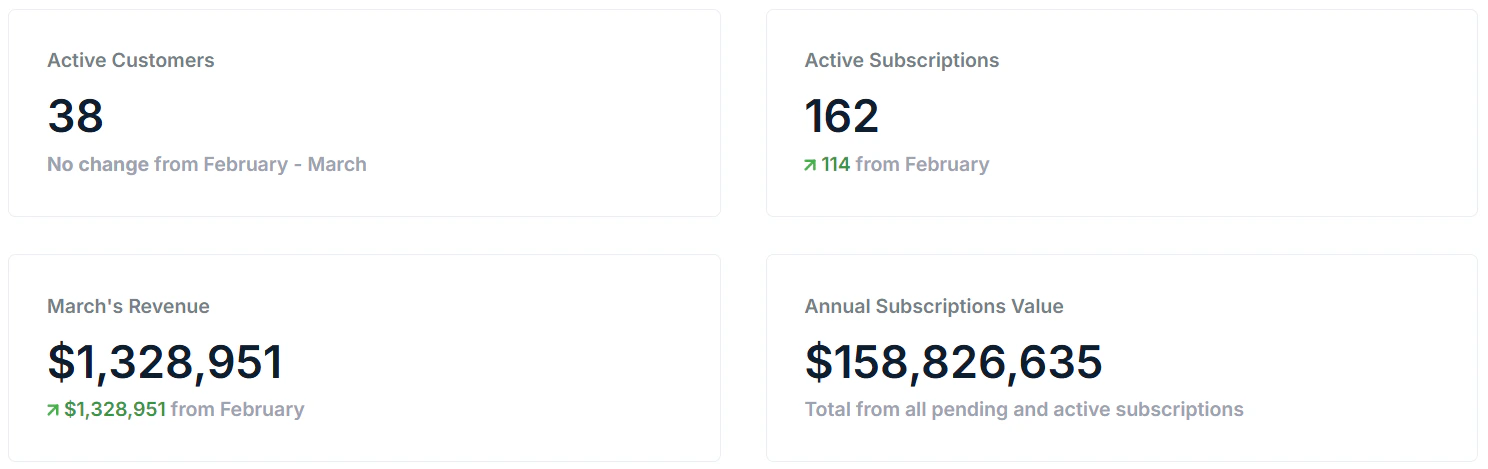
Four summary tiles sit at the top of the dashboard. Each tile shows the current value alongside a comparison to the previous month so you can spot movement at a glance.
| Tile | What it shows |
| ------------------------------ | ------------------------------------------------------------------------------- |
| **Active Customers** | The number of customers with the active status |
| **Active Subscriptions** | The total number of currently active subscriptions across all customers |
| **Current Month's Revenue** | Revenue from approved and paid invoices generated in the current calendar month |
| **Annual Subscriptions Value** | The annualised value of all pending and active subscriptions |
Revenue figures are based on invoices created in Saasybill and reflect the company currency set in your settings. If you bill in multiple currencies, values are converted, and exchange rates are calculated at the time of invoice creation.
***
## Getting started
If your account is newly set up, a **Getting Started** tile appears on your dashboard. It guides you through the initial steps of syncing customers, creating your first plan, and adding your first subscription.
This tile disappears once you have completed all the Getting Started steps
***
## Key metrics
Four summary tiles sit at the top of the dashboard. Each tile shows the current value alongside a comparison to the previous month so you can spot movement at a glance.
| Tile | What it shows |
| ------------------------------ | ------------------------------------------------------------------------------- |
| **Active Customers** | The number of customers with the active status |
| **Active Subscriptions** | The total number of currently active subscriptions across all customers |
| **Current Month's Revenue** | Revenue from approved and paid invoices generated in the current calendar month |
| **Annual Subscriptions Value** | The annualised value of all pending and active subscriptions |
Revenue figures are based on invoices created in Saasybill and reflect the company currency set in your settings. If you bill in multiple currencies, values are converted, and exchange rates are calculated at the time of invoice creation.
 ***
## Upcoming renewals
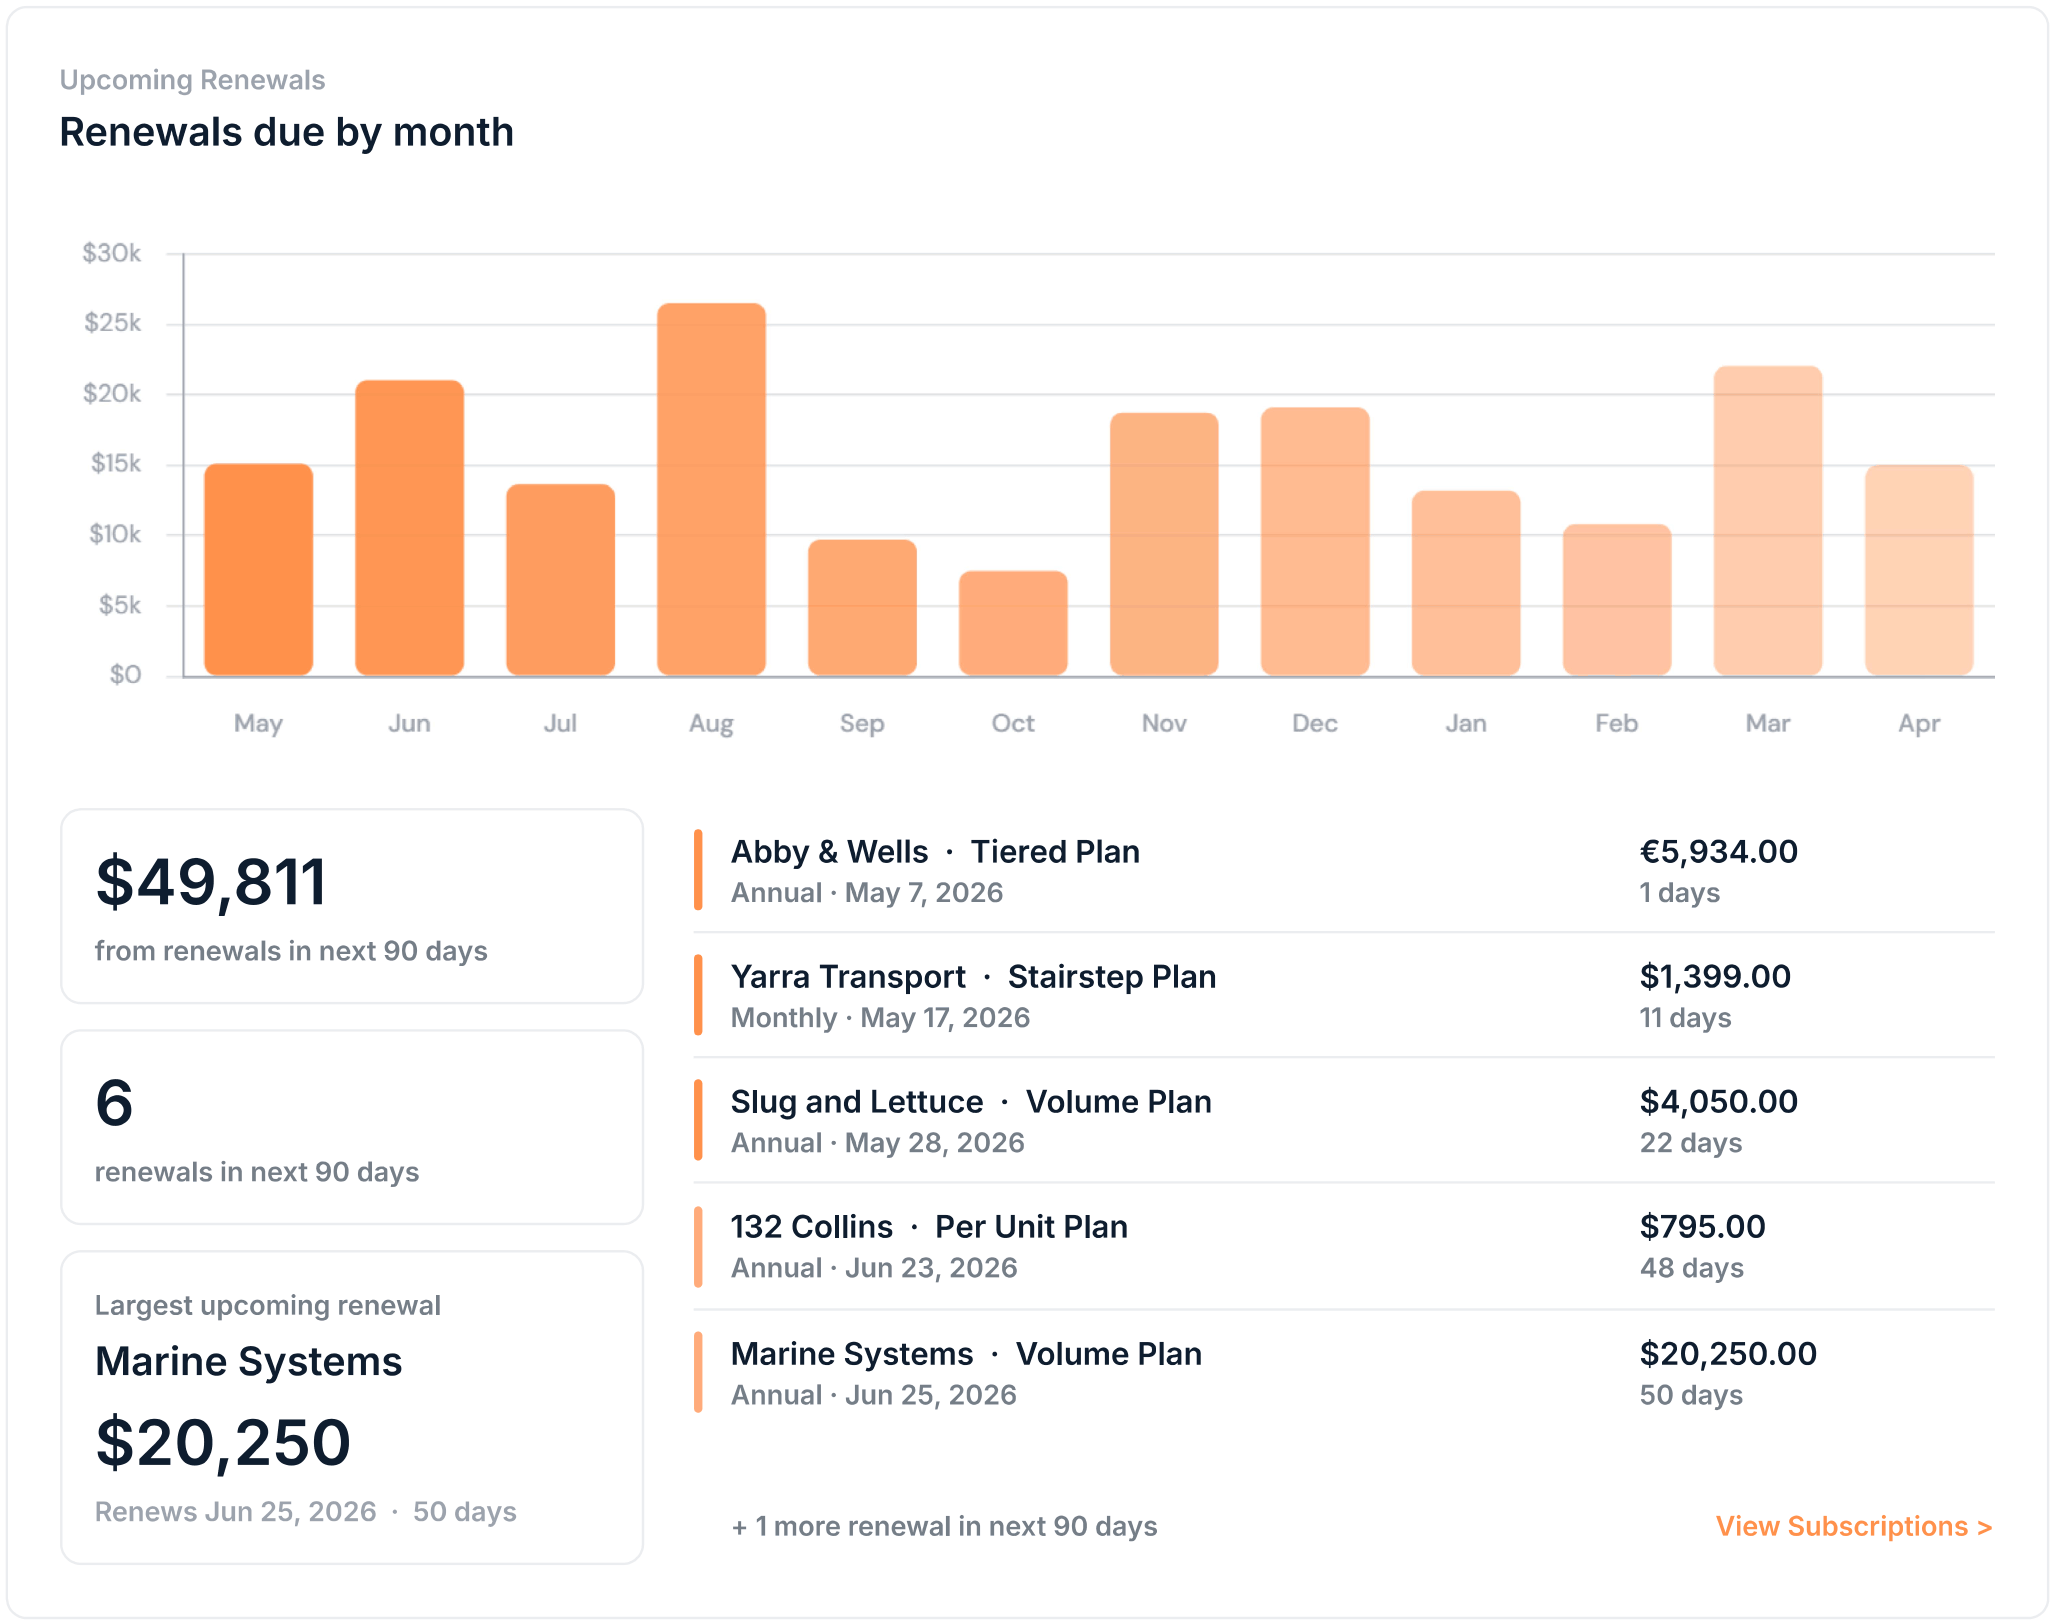
The renewals widget summarises renewal activity in the next 90 days, and shows a forecast for the upcoming year. In the table, subscriptions are listed by earliest renewal date, showing the renewal date, value, and days remaining. Click any row to open the subscription details.
Renewal value is based on the subscription's current units, not what was paid in the current period. If a subscription has been updated since its last renewal, the renewal value reflects the latest unit count.
***
## Upcoming renewals
The renewals widget summarises renewal activity in the next 90 days, and shows a forecast for the upcoming year. In the table, subscriptions are listed by earliest renewal date, showing the renewal date, value, and days remaining. Click any row to open the subscription details.
Renewal value is based on the subscription's current units, not what was paid in the current period. If a subscription has been updated since its last renewal, the renewal value reflects the latest unit count.
 ***
## Revenue
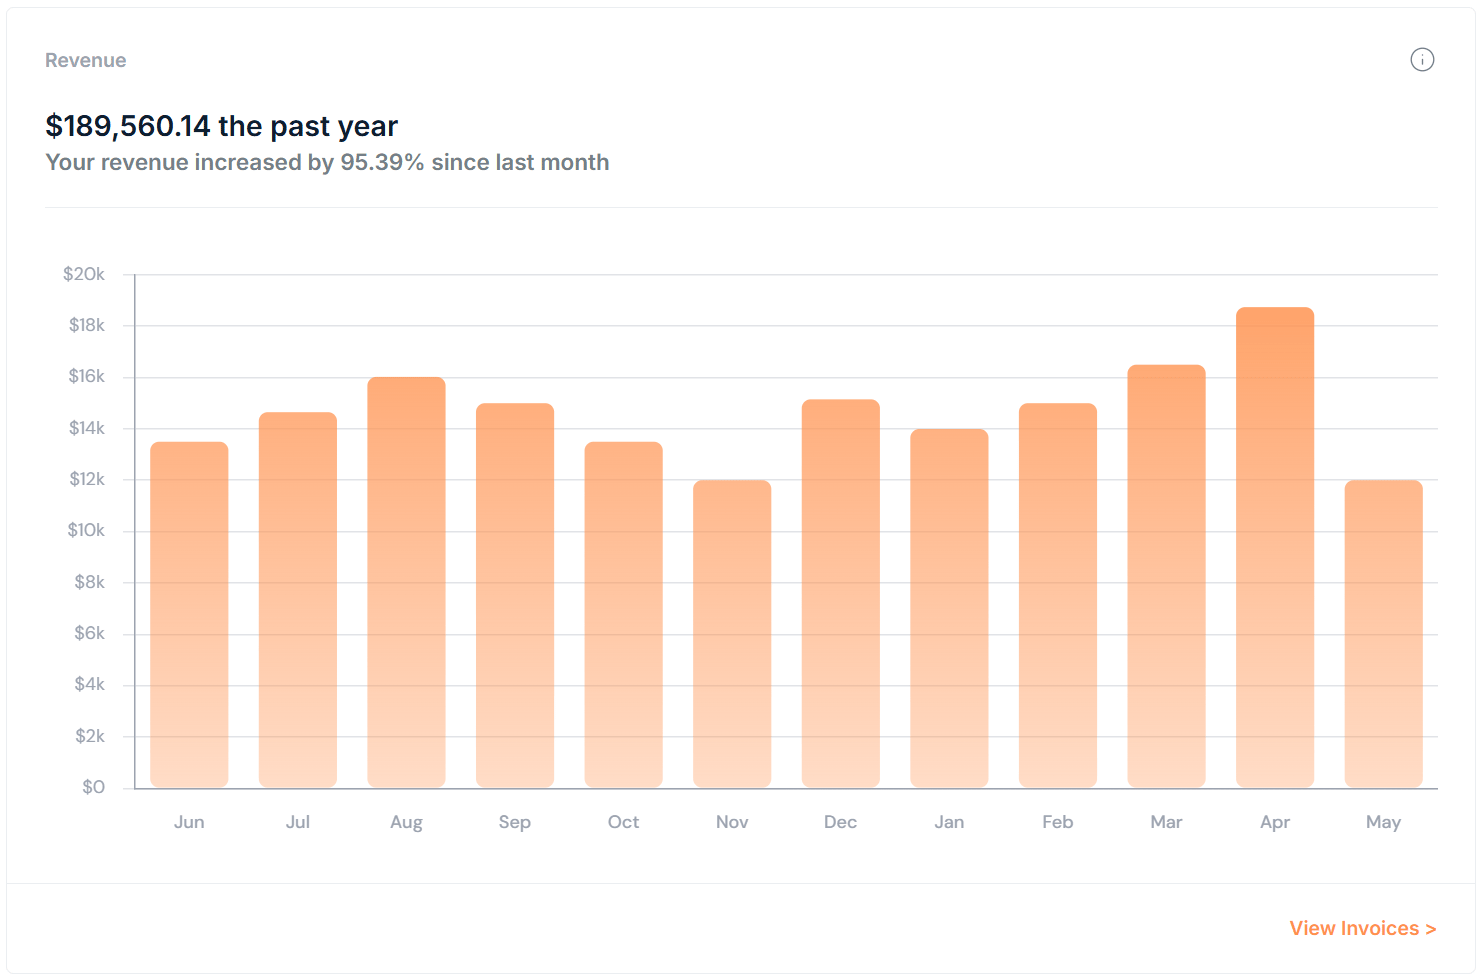
Below the renewals, the revenue chart shows combined revenue over the past year. Use this to track billing trends across months.
Revenue is calculated from approved and paid invoices over the past 12 months.
***
## Revenue
Below the renewals, the revenue chart shows combined revenue over the past year. Use this to track billing trends across months.
Revenue is calculated from approved and paid invoices over the past 12 months.
 ***
## Revenue breakdown
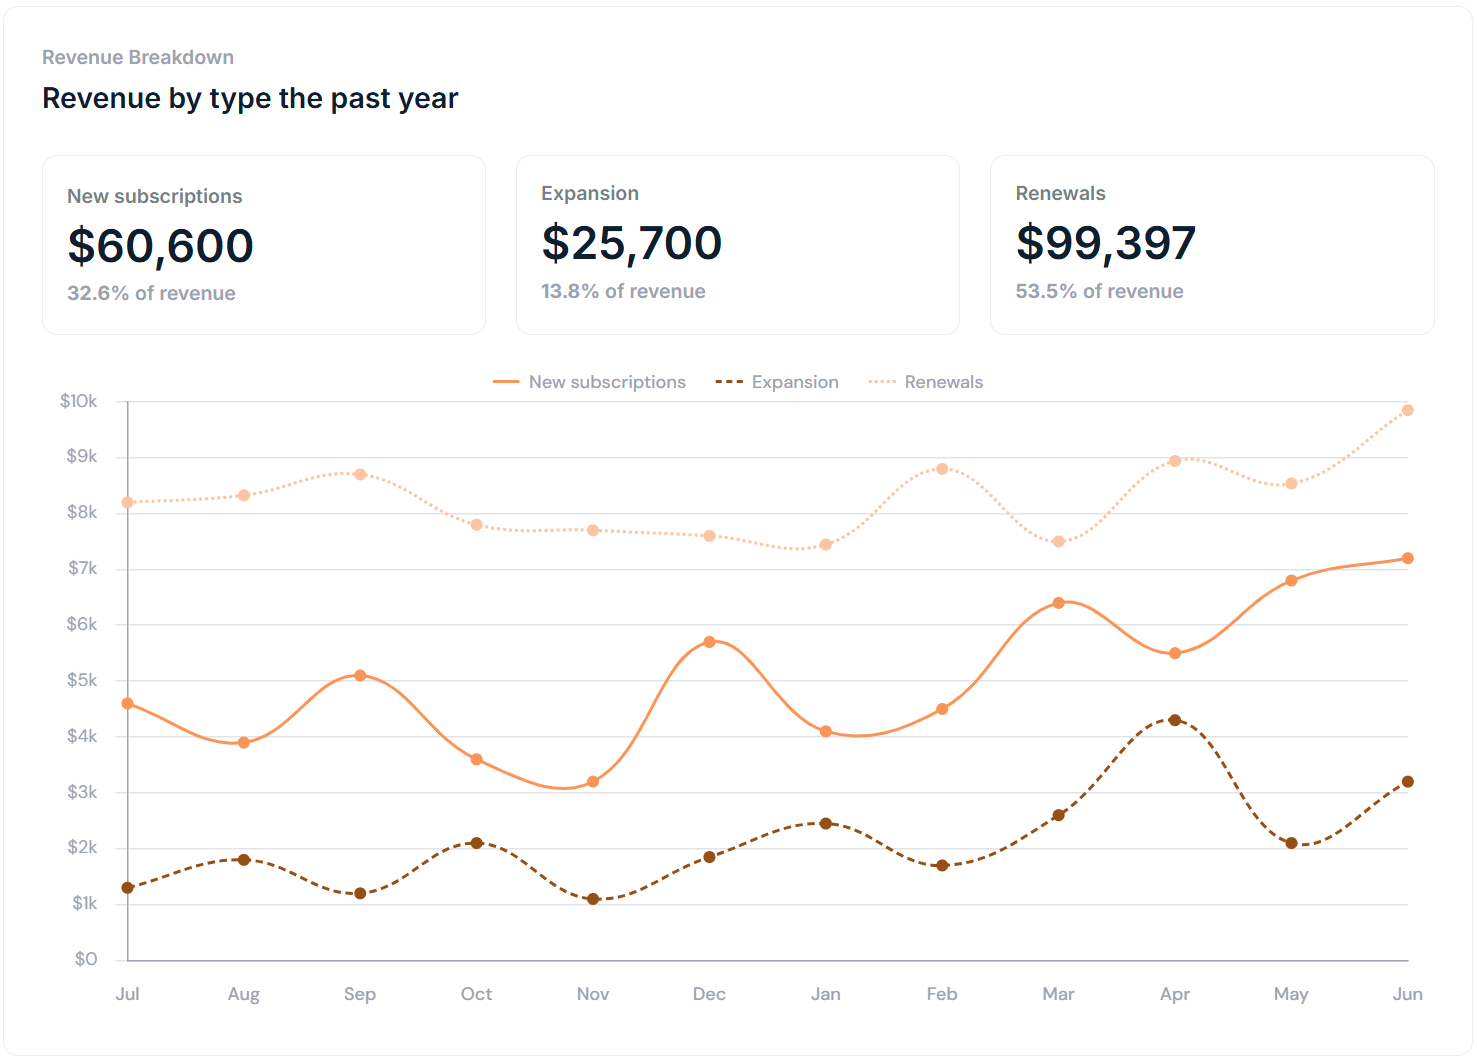
The revenue breakdown shows how revenue from the past year is split across **New subscriptions**, **Expansion**, and **Renewals**. Each category shows the total amount and its share of overall revenue, with a monthly trend.
Revenue breakdown is calculated from approved and paid invoices over the past 12 months.
***
## Revenue breakdown
The revenue breakdown shows how revenue from the past year is split across **New subscriptions**, **Expansion**, and **Renewals**. Each category shows the total amount and its share of overall revenue, with a monthly trend.
Revenue breakdown is calculated from approved and paid invoices over the past 12 months.
 ***
## Revenue sources chart
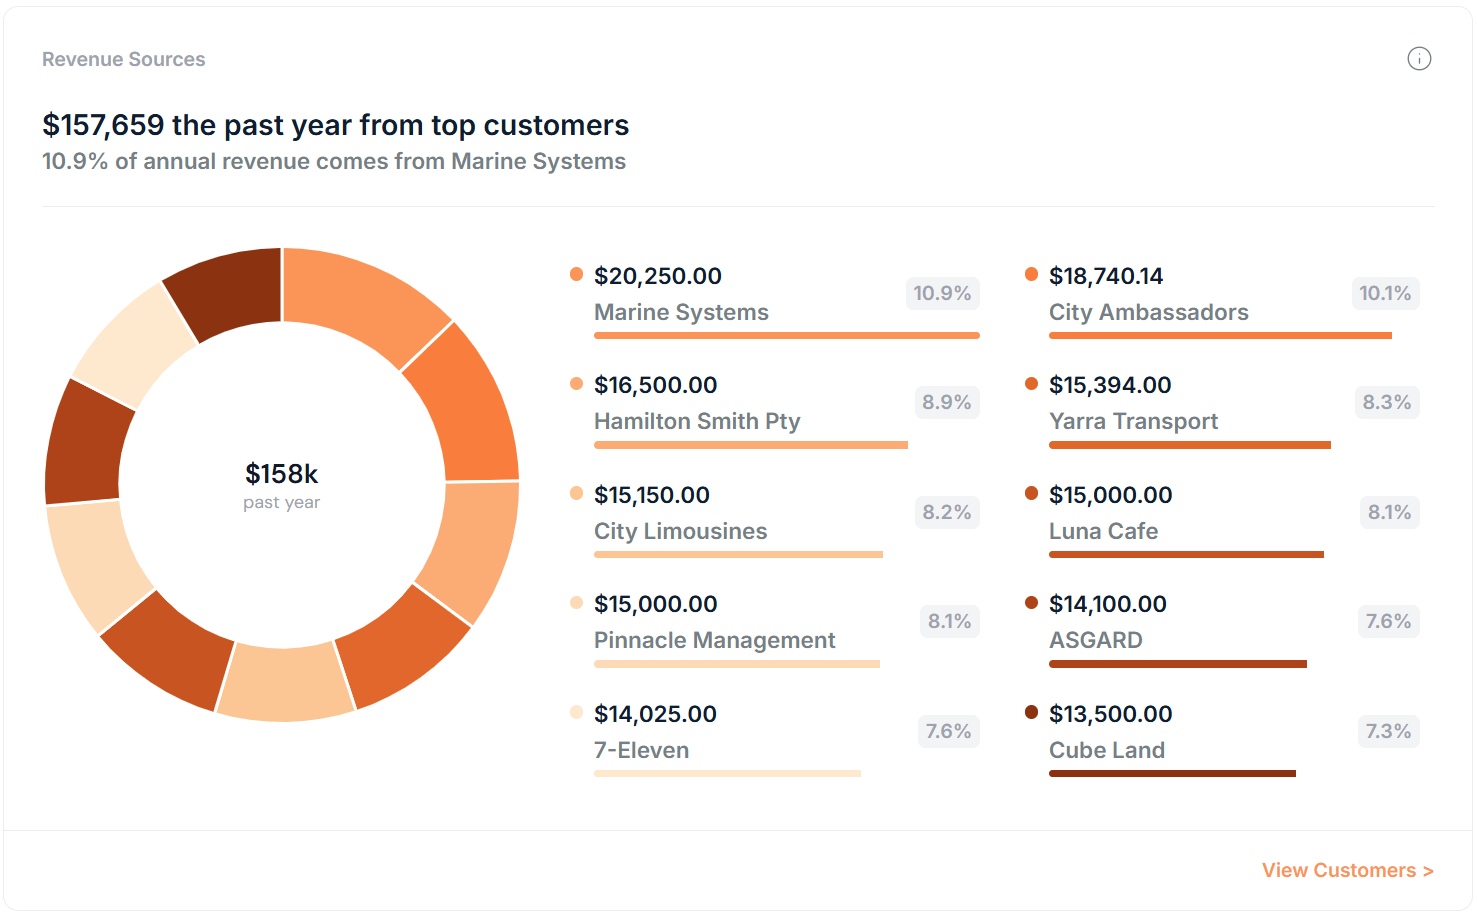
The revenue sources chart breaks down your revenue by customer for the past year, showing your top revenue generating customers and their contribution across all subscriptions to your overall billing. Use this to understand customer revenue concentrations.
Revenue sources are calculated from approved and paid invoices over the past 12 months.
***
## Revenue sources chart
The revenue sources chart breaks down your revenue by customer for the past year, showing your top revenue generating customers and their contribution across all subscriptions to your overall billing. Use this to understand customer revenue concentrations.
Revenue sources are calculated from approved and paid invoices over the past 12 months.
 ***
## What the dashboard doesn't show
There is more detailed data available elsewhere in the app:
* For individual invoice records and statuses, go to [Invoices](https://app.saasybill.com/login?fw=invoices)
* For a full list of customers and their subscriptions, go to [Customers](https://app.saasybill.com/login?fw=customers)
* For subscription-level detail including credit balances and history, go to [Subscriptions](https://app.saasybill.com/login?fw=subscriptions)
***
## What the dashboard doesn't show
There is more detailed data available elsewhere in the app:
* For individual invoice records and statuses, go to [Invoices](https://app.saasybill.com/login?fw=invoices)
* For a full list of customers and their subscriptions, go to [Customers](https://app.saasybill.com/login?fw=customers)
* For subscription-level detail including credit balances and history, go to [Subscriptions](https://app.saasybill.com/login?fw=subscriptions)